For details of the model, please see its description on the 2004 Model Page. The basic concept is the same, except mostly Class III Senatorial races are being considered in the betting. The 34 Class III incumbents (16 Democrats, 18 Republicans) are augmented this year with 2 Class I Democrats (NY's Clinton & WV's Byrd replacements) and 1 Class II Democrat (DE's Kaufman), so a total of 37 Senate seats are up for vote (& thus form the basis for the model). In other words, the not-running Class I (20 Democrats, 10 Republicans & 2 Independents) and Class II (18 Democrats & 13 Republicans) Senators (terms expiring in 2013 and 2015, respectively) form a constant population of 38 Democrats, 23 Republicans and 2 Independents, with the remaining 37 seats in contention.
Without further ado, here is my daily predicted outcome .
Happy Voting!
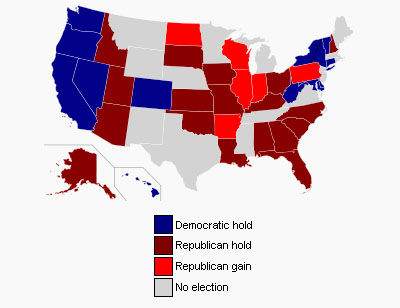
October 29, 2011. Well, it's been a while since I visited the models, but with the 2012 Presidential Election occuring in about a year, it's time to comment on the 2010 model results. The Republicans defeated two Democratic incumbents (Lincoln in AR and Feingold in WI). They also won open seats in IL, IN, ND and PA. This was the largest number of Senate gains for Republicans since the 1994 election (and the first time since that election that all of their own Senate seats were successfully defended). It's worth bearing in mind that the pre-election 111th Senate had 57 Democrats, 41 Republicans and 2 Independents.
First, let's compare the model prediction with the election result now reflected in the 112th Senate
Model Prediction: 49 Democrats, 49 Republicans, 2 Independents
Election Results: 51 Democrats, 47 Republicans, 2 Independents
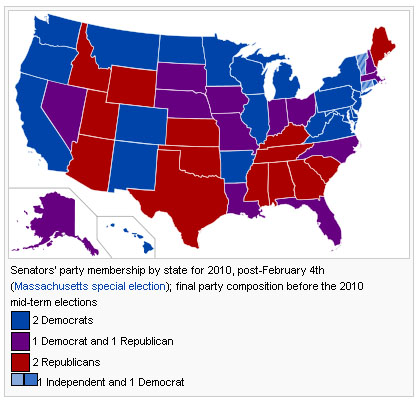
The 2010 Senate election looks like this in terms of the various states... and like this in terms of State-by-State gains and losses
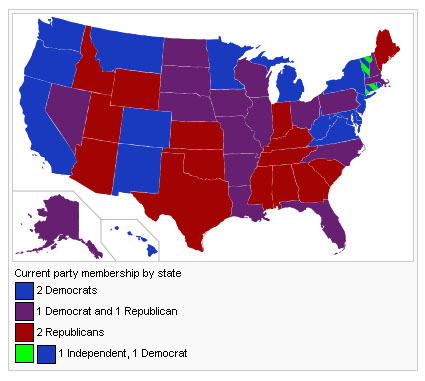
The pre-2010 Senate looked like this in terms of the various states...
So, did the 2010 Senate mid-term model fail and if so, why? It did not successfully predict the 2010 absolute results, nor did it predict that the Democrats would maintain a slight lead. It predicted a Democratic and Republican tie.
The utility of the model is derived primarily from its use of local, highly granular information that influences how people wager at the State level. The widely varying levels of investment in State contracts meant that in some cases very little if any trading occurred, which might be explained if bettors considered some elections "foregone conclusions". However, the hotly contested States had much trading; the open question is just how much of this was driven by "wishful thinking" partisanship as opposed to dispassionate market-driven insights.
This experiment in wager-based election prediction continues, with data-gathering to resume in March 2012 for the no-doubt dramatic Presidential election!